- The S&P 500 saw a surprising 4.8% surge in May, bucking historical patterns.
- Yet, concerns arise as fewer stocks partake in the rally, hinting at potential bearish indicators.
- With speculations swirling around a potential Fed rate cut come September, investors are on high alert.
May ended on a high note, with the marking a 4.8% gain – its best showing in 15 years.
But let’s shift our gaze to June.
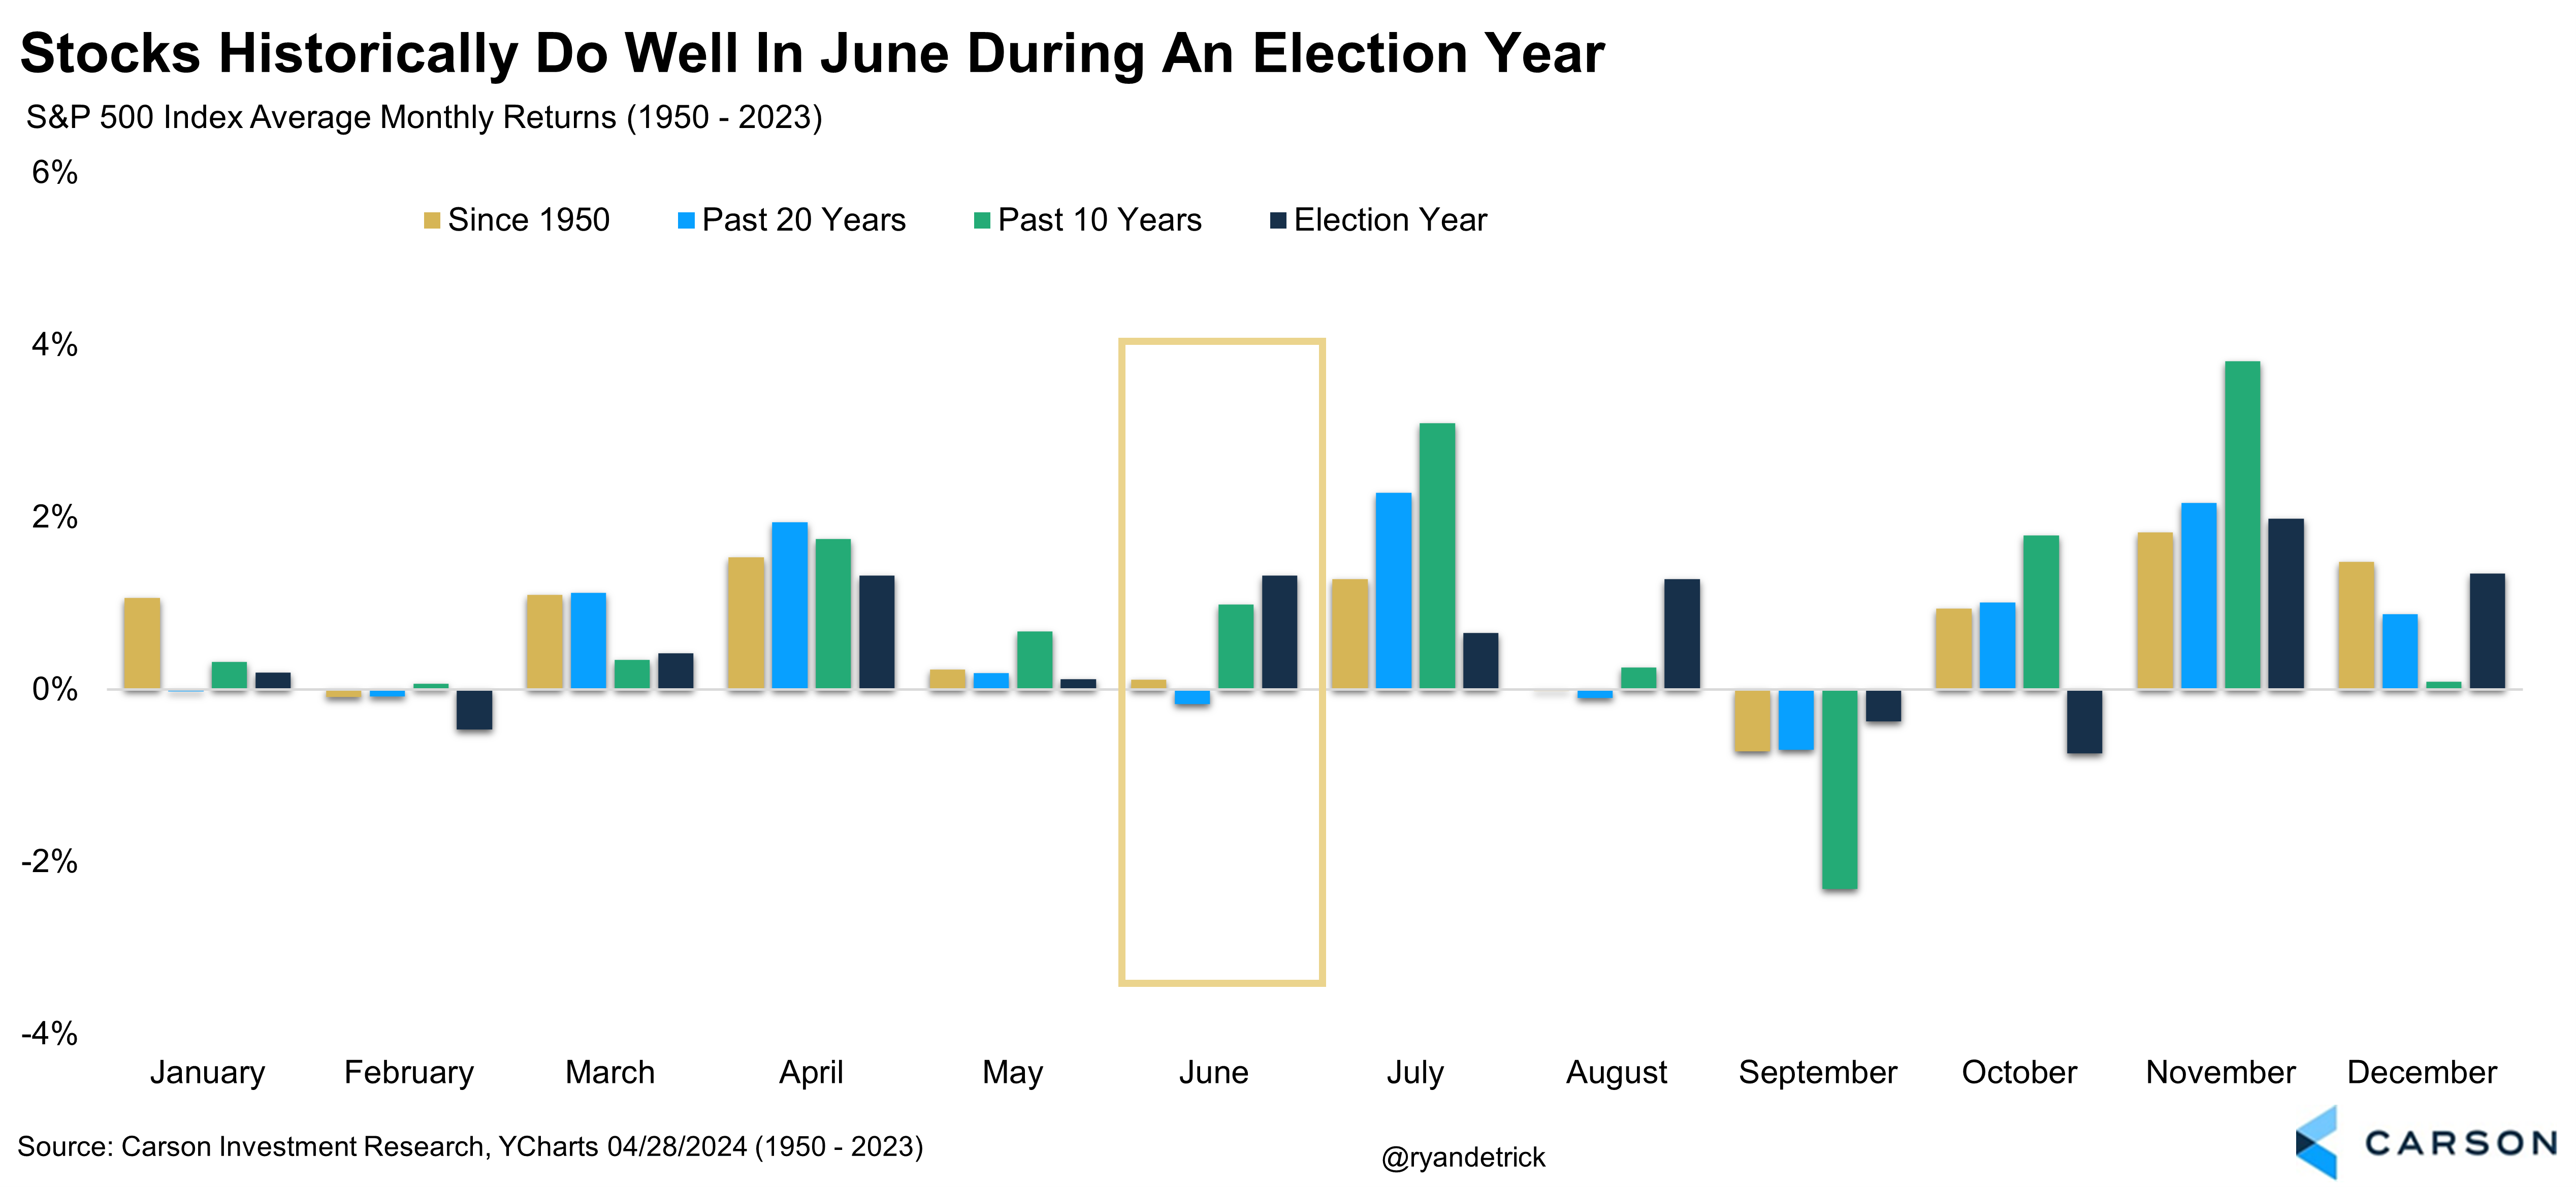
Historically, June has had a more predictable path, averaging a modest 0.1% return since 1950.
More impressively, June delights 55% of the time with an average 0.7% gain per month. In election years, the index typically soars by an average of 1.3%.
Anxieties Loom Over Market Breadth
Yet, a recent snag has surfaced despite the hitting new peaks for the year (achieving its 24th record high) and since March. Market breadth, measuring stock participation in the rally, shows signs of faltering.
While the index climbs, gains seem concentrated in a small group of large-cap stocks.
A distressing pattern emerged recently. Around 20% of large-cap stocks hit a 3-month low, a scenario unseen since October 2023.
Moreover, the dwindling count of stocks trading above their 50-day moving average hints at a potential shift towards bears.
This is further bolstered by the dip in stocks hitting new 52-week highs and trading above their 200-day moving average compared to March. 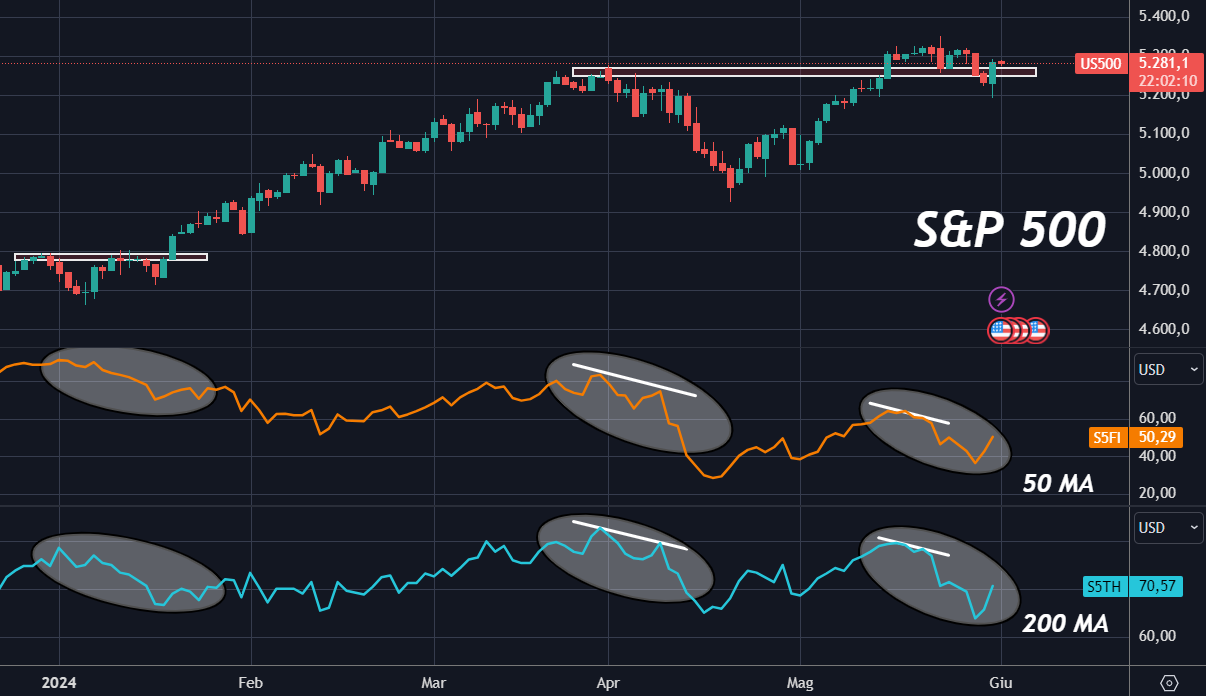
The stark resemblance to April’s downturn in the chart is noteworthy. While the index broke its previous apex in May, the rally’s participation was limited.
This stark difference from the broad market engagement earlier in the year when more stocks moved above their 50-day and 200-day averages signals a bearish tone.
Could June See a Steep Correction?
While market retracements and fluctuations are normative, 2024 has been surprisingly tranquil. The year’s biggest slump has only been 5.5%, making it one of the most stable periods in recent memory.
This subdued volatility raises eyebrows, given prevailing concerns about interest rates, inflation, and global tensions. Market responses to data releases and events have been notably muted. 
Historically, average yearly market wobbles total 14.2%, with non-bear market declines resting at 10.1%. This underlines that even robust markets witness temporary downturns.
The 5% dip observed thus far in 2024 may just be the start. Uncertainties are likely to resurge, triggering further market undulations, albeit hopefully not enduring or severe.
Eyes on a Rate Cut to Reignite Market Sentiment
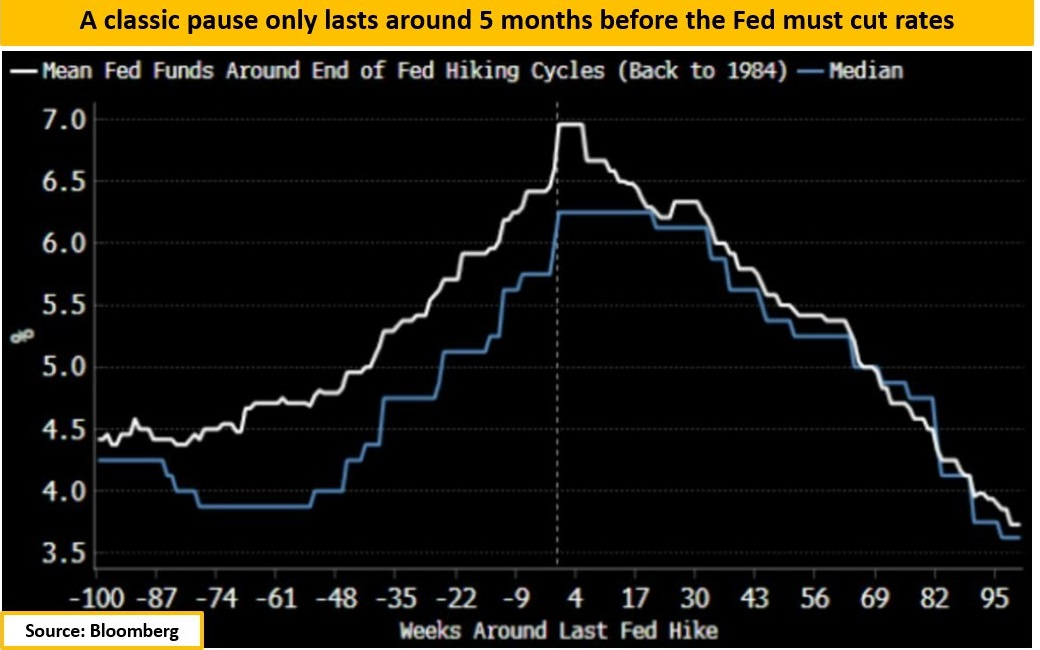
Many are anticipating the Fed’s inaugural rate cut in September.
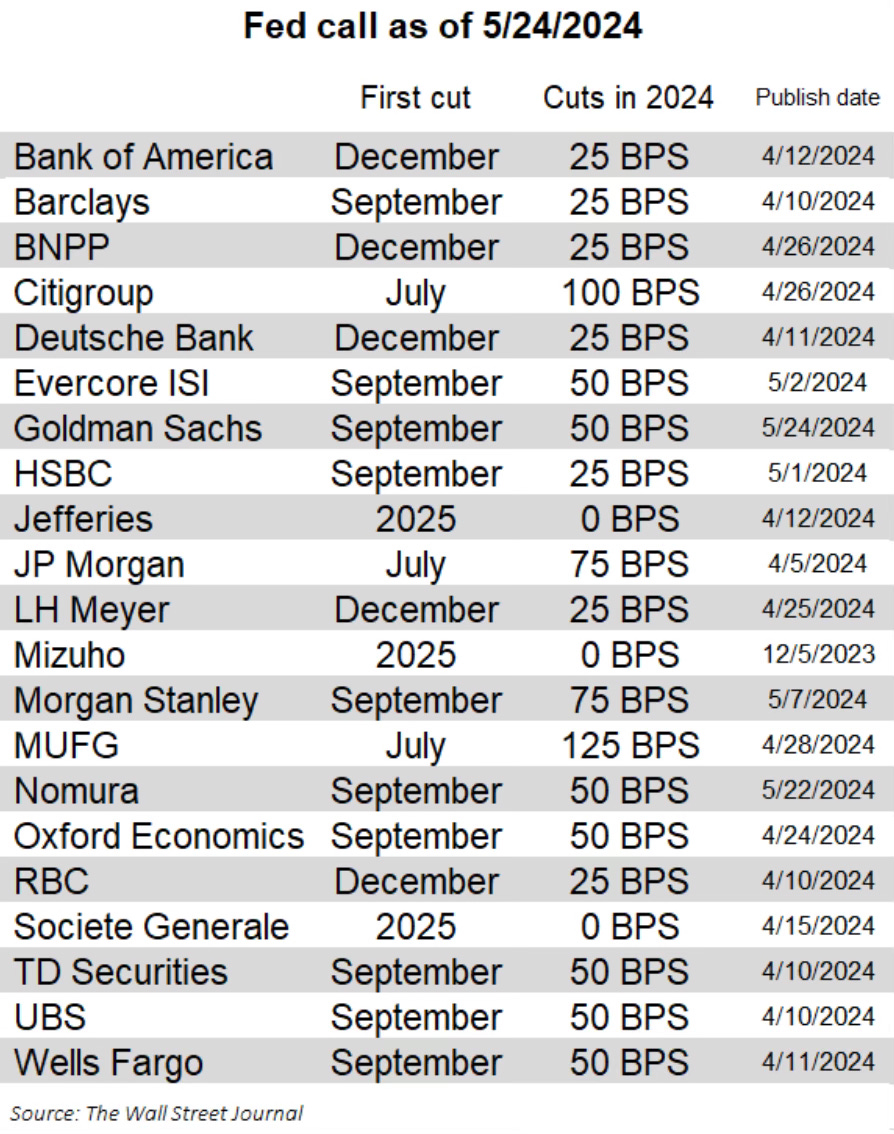
Investing.com’s reveals market forecasts aligning with this anticipation. Presently, there’s a 47% likelihood of a rate cut by the September 18th meeting. 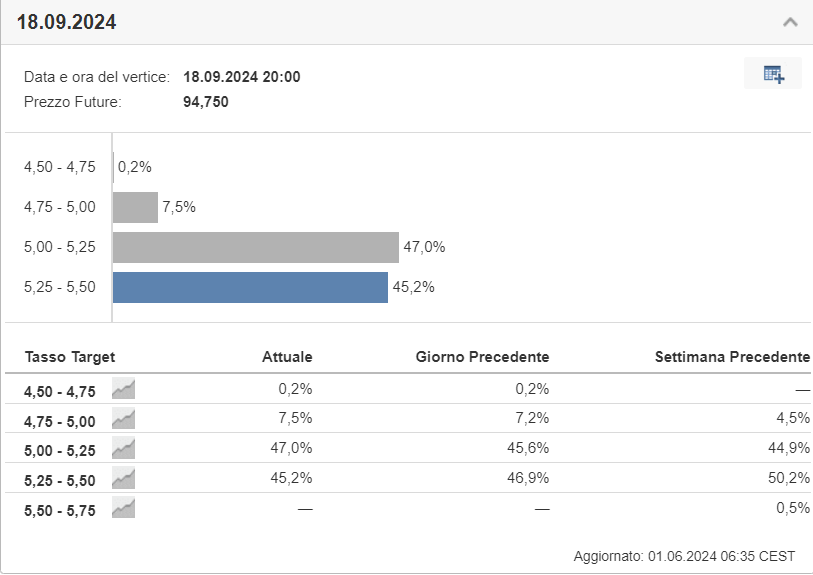
Investors are on the lookout for pivotal cues – could this potential rate adjustment reignite the ongoing bull market?
***
Become a Pro: Join the PRO Community at a discount by CLICKING HERE.

Disclaimer: This article is crafted solely for informational purposes; it does not amount to a solicitation, offer, advisory, recommendation, or inducement for investment. It’s crucial to remember that asset evaluation involves numerous viewpoints and is inherently risky, hence all investment decisions and risks are the investors’ responsibility.
